
Appointments NoShow
Why so many people do not show up for their medical appointments? Is it normal to have a 20% of noshows? Well, I though this
was an interesting question that deserved, at least, my attention. I had to main reasons: the first one was the economic
impact it has in the underemployment of public resources and, most importantly, the social cost that has in the patient, in
his/her family and in the future.

Brief description of Appointments No-Show.
- Dataset contains 110k medical appointments that took place in Vitoria, Brazil in between April 29th and Jun 8th 2016.
- The baseline is 79.8% of showups.
- The link: AppointmentsNoShow on GitHub for a more detailed and
technical explanation.
Non-technical description of Appointments No-show study.
##Gathering the data.
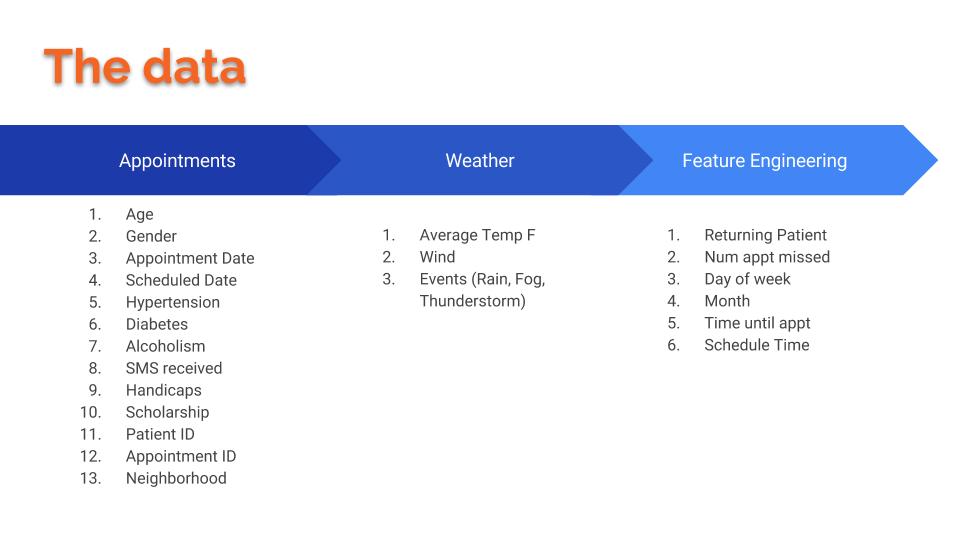
No pain, no gain and, I would add, no data no project. I obtained all the data from Kaggle and thanks to altruistics efforts. Every row in the file of 110k of them that I obtained was an appointment and for each appointment I had the information listed under Appointments. Then, happily thinking that the weather would be a key factor, I scraped data and added weather information to the mix for the days of the appointments (Under Weather) and finally through feature engineering, I created new ones that end up being important (under Feature Engineering).
##Getting to know our Data.
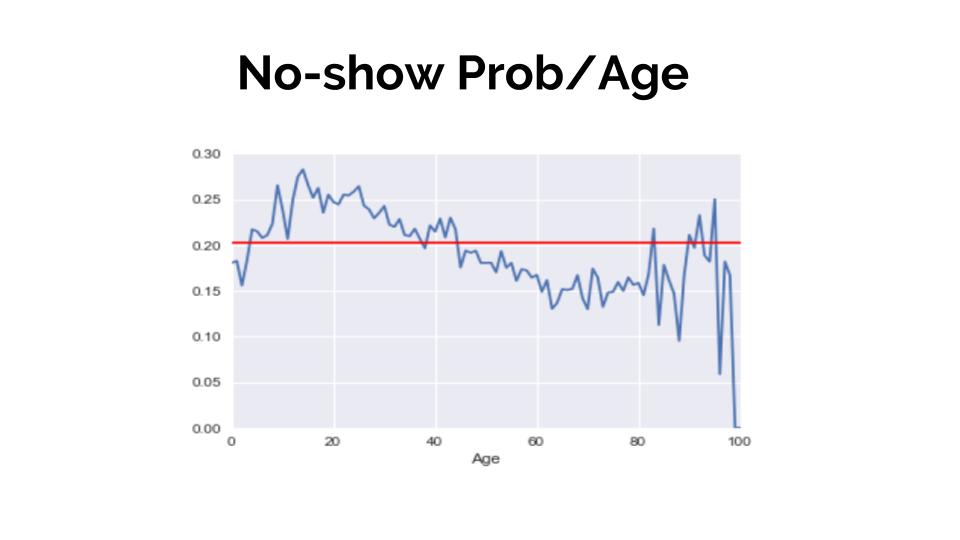
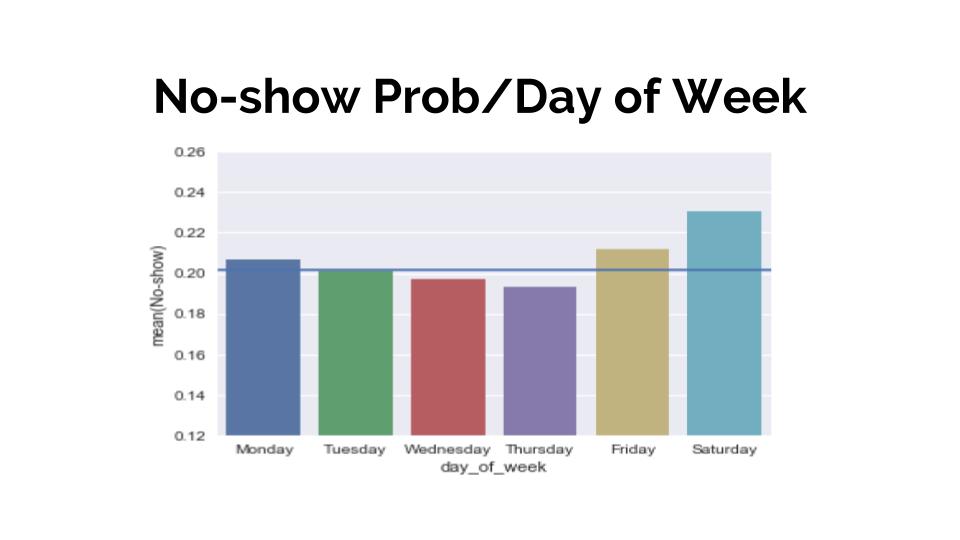
Once all the feature engineering was done, it was time to get to know the data and its features. The way to do it is to see how this variables are affected by the target. I just show a coup,e of graphs where I measure age and tthe day of the week to the show/no-show. At the same time, I draw a line representing the baseline for a better interpretation.
##What about the model?
In order to select the model, I preselect the features and ordered them based on its correation to our taget. With the
sorted, I ran almost all models available while loopong over the features adding 2 everytime and scoring its accuracy.
As usual, I compared the score to the baseline.
The reasons to do it this way was to select the model while also selecting features.
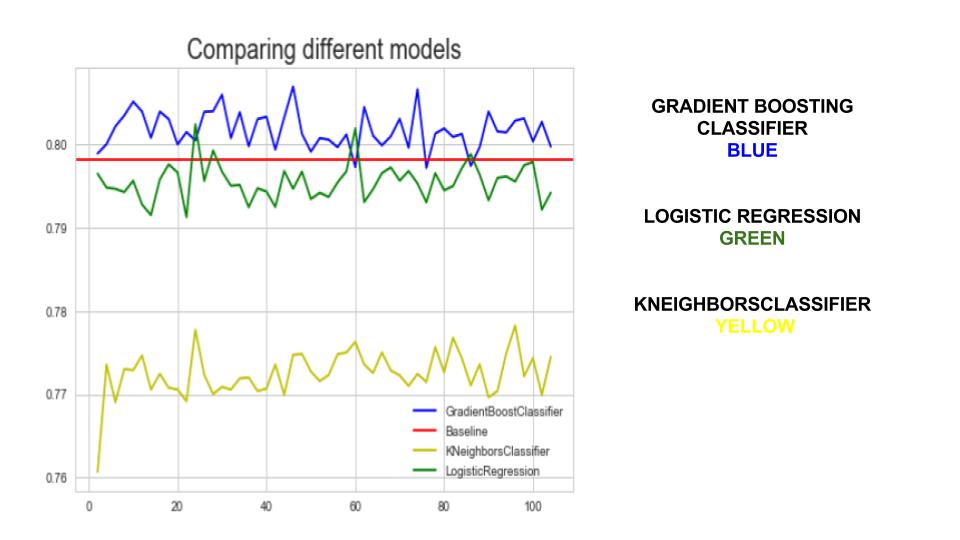
The winner was Gradient Boosting Classifier.
##Conclusions
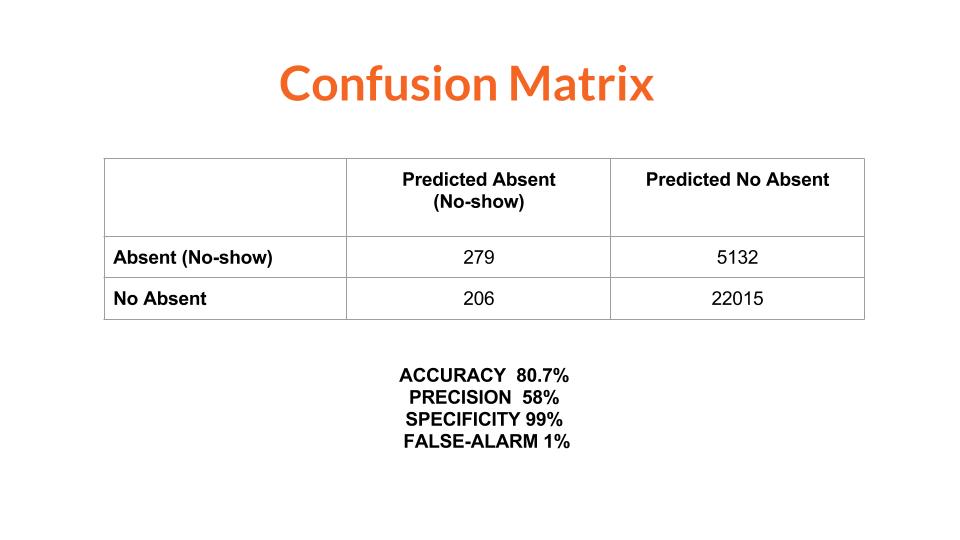
Based on the score:
A. I obtained an accuracy of 80.7% that is 0.9% improvement what means (considering every appointment would take an average
of 30 min) a saving of 374 hours per month.
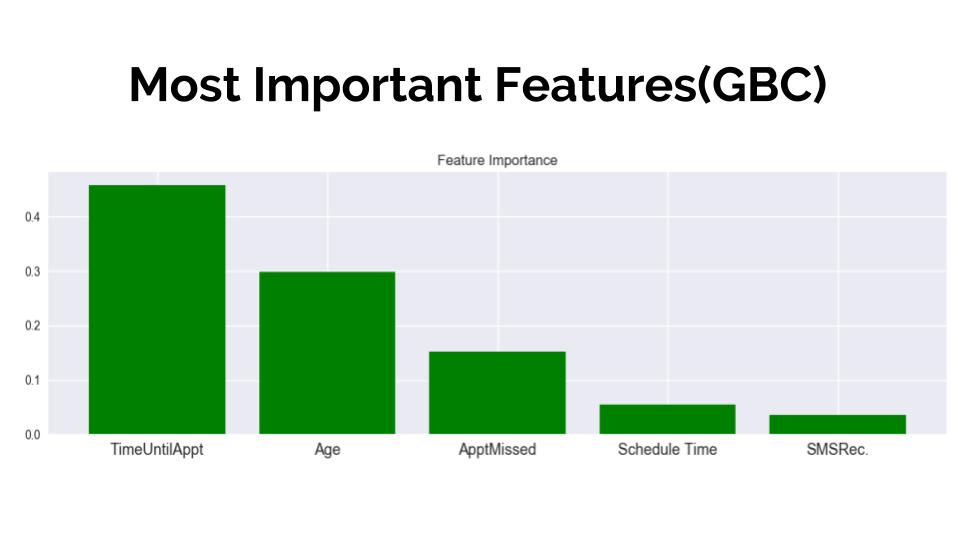
B. I discovered which the most important features are. I have to say that they did not surprising and I wold call it the
vistory of the common sense: Time betwwen schedule an appointment, age and appointments missed previously. The rest of the
fetuares happened to be of way least importance.
As any other project in life, this is not totally done. I want to tweak the model, add more data and try a Bayes approach. Thank you for your attention and interest.